2.4. Transistor I-V Characteristics#
2.4.1. Oscilloscope Measurements#
IDS-VDS Measurement#

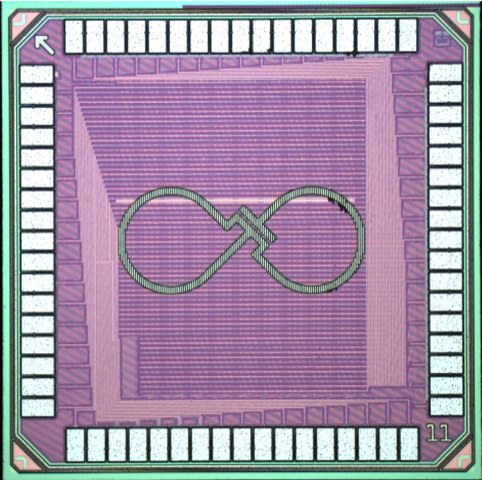
Fig. 2.44 Measurement setup for IDS-VDS measurements of an 2x nMOS device; with CH1 (1+ & 1-) we measure the VDS and with CH2 (2+ & 2-) we measure the current given that R1 is \(100\Omega\)#
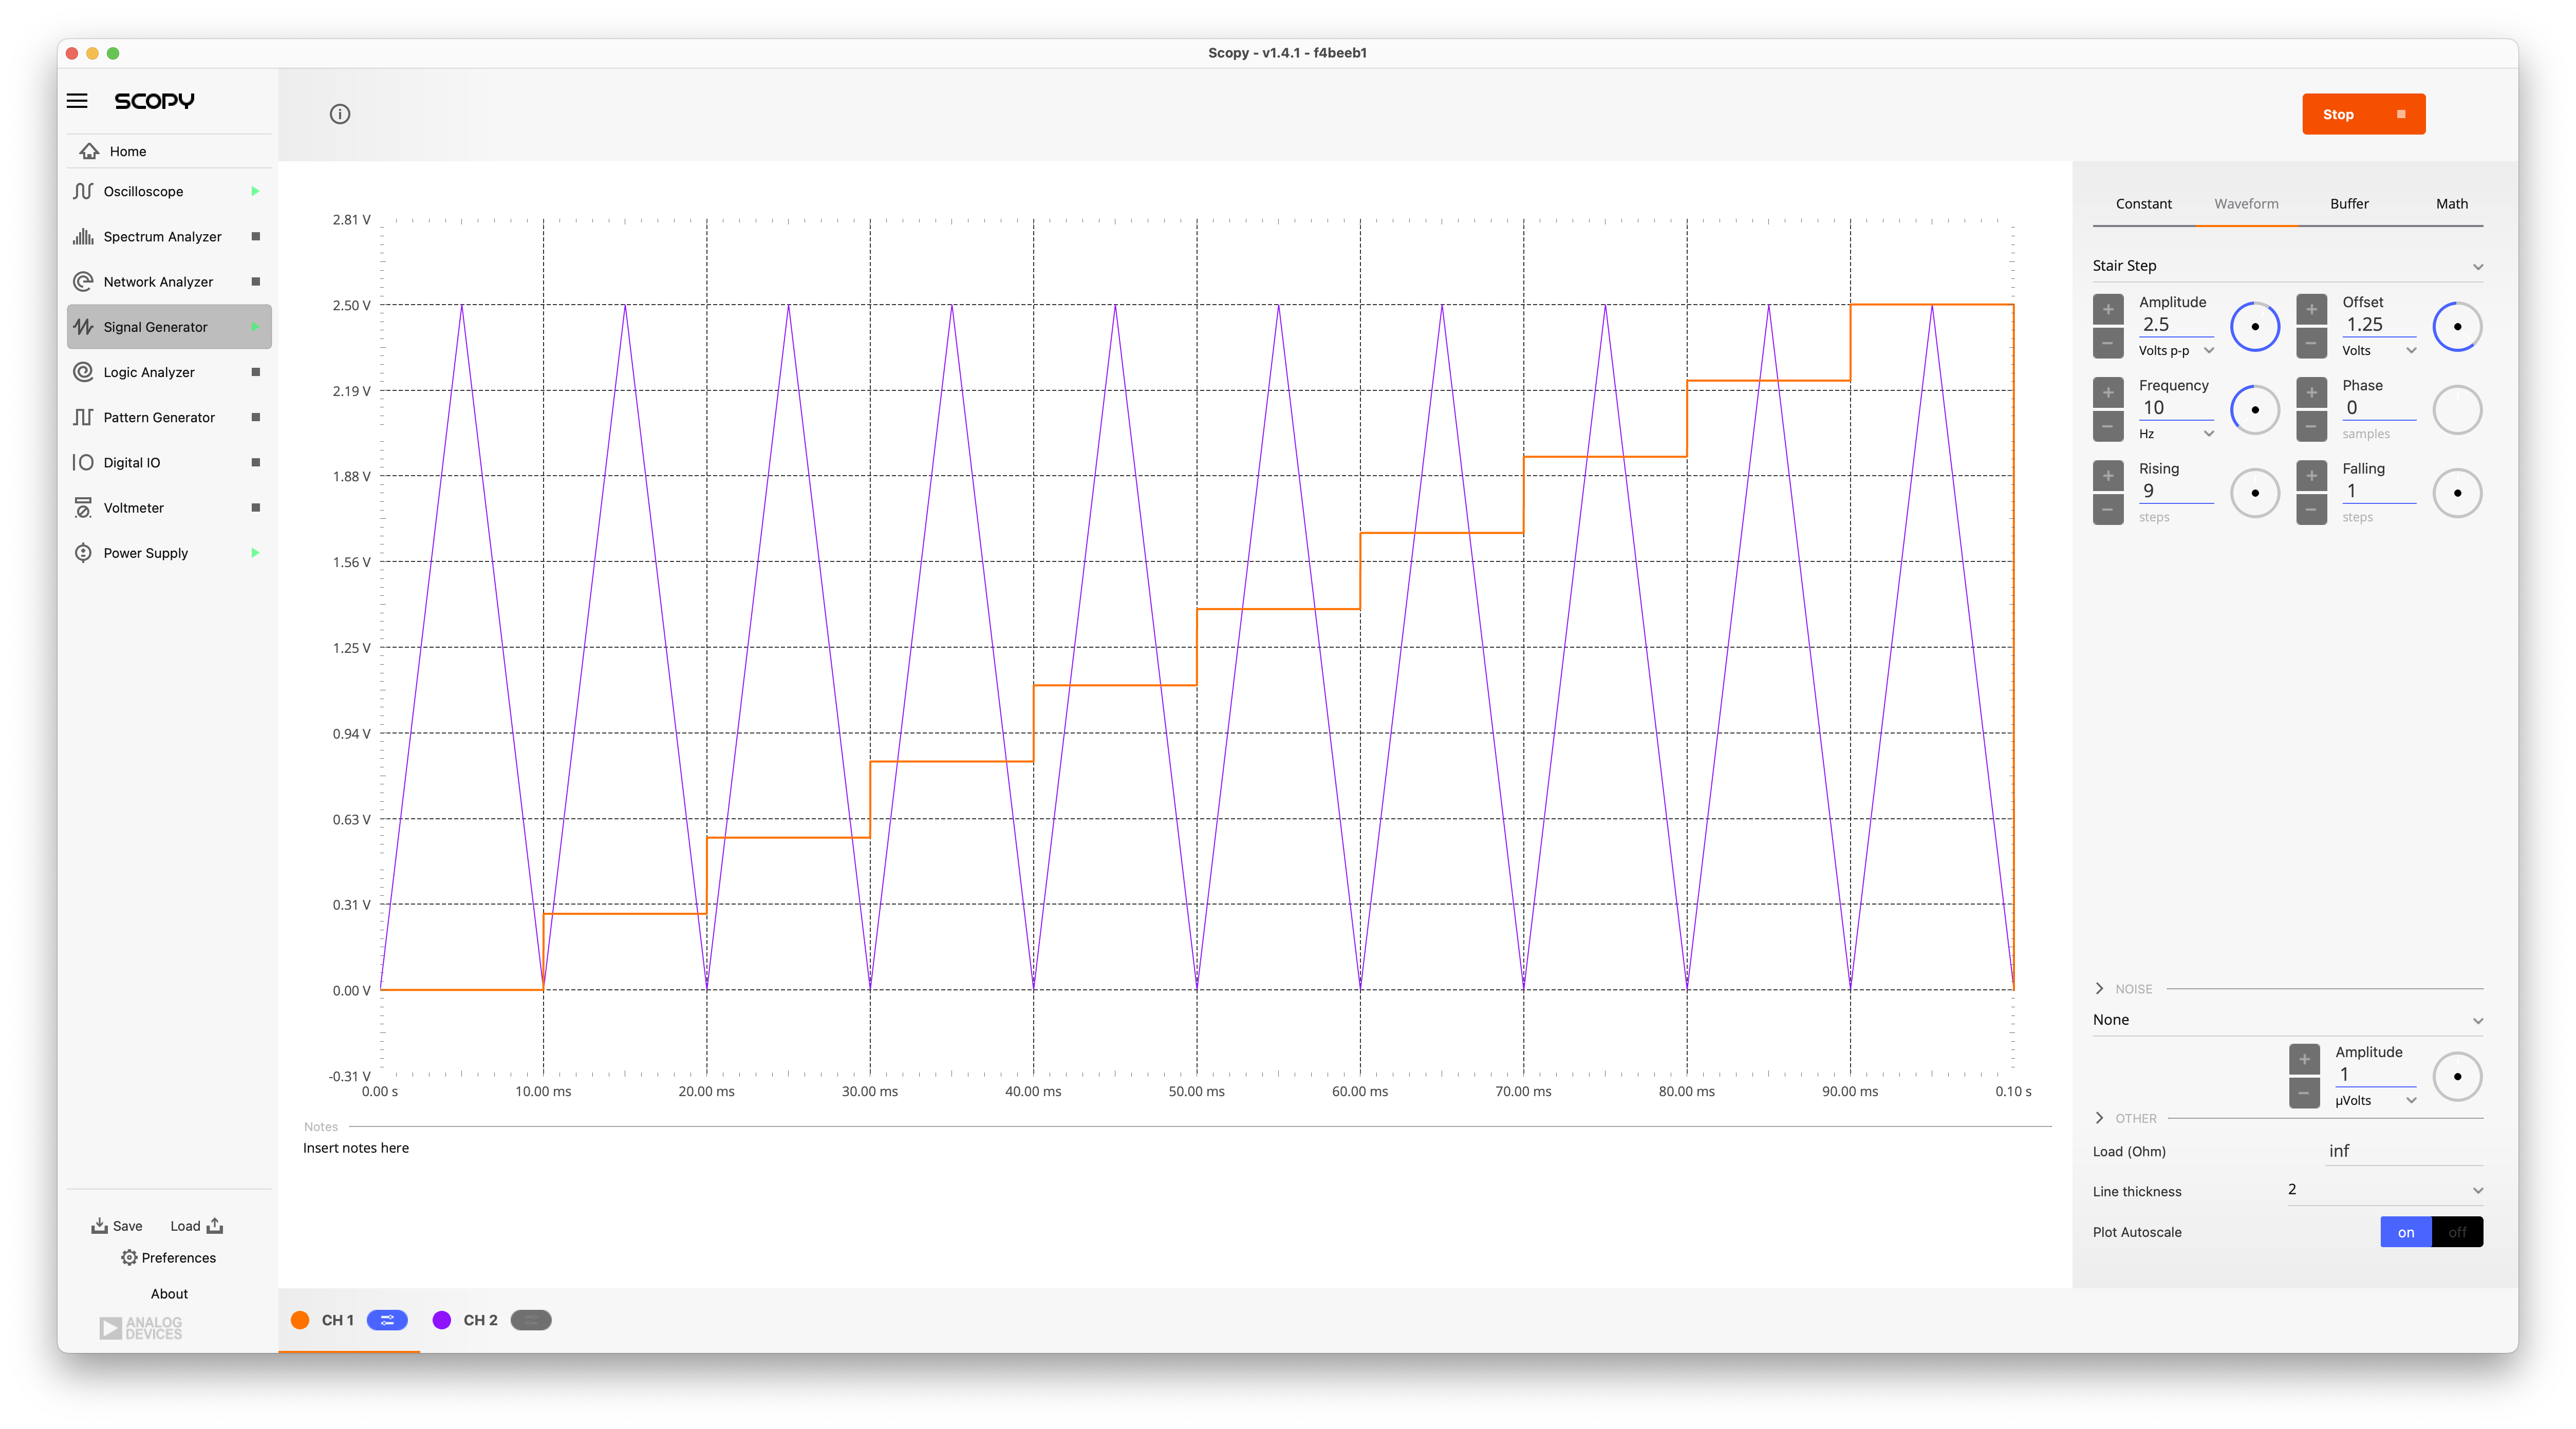
Fig. 2.45 VGS (orange) and VDS (purple) waveforms used for the IDS-VDS measurements#
We performed nMOS IDS-VDS measurements for varying VGS by connecting the ADALM2000 waveform generator W1 to the gate of the transistor under test and the drain to the waveform generator W2 through a \(100 \Omega\) series resistor \(R_1\). The scope channel 1 measures the drain to source voltage (VDS) and the 2 channel measures the voltage across the drain series resistor.
The VGS voltage is stepped from 0.25 to 2.50V in 9 steps of 278mV, and for each VGS the VDS voltage is swept from 0 to 2.5V.
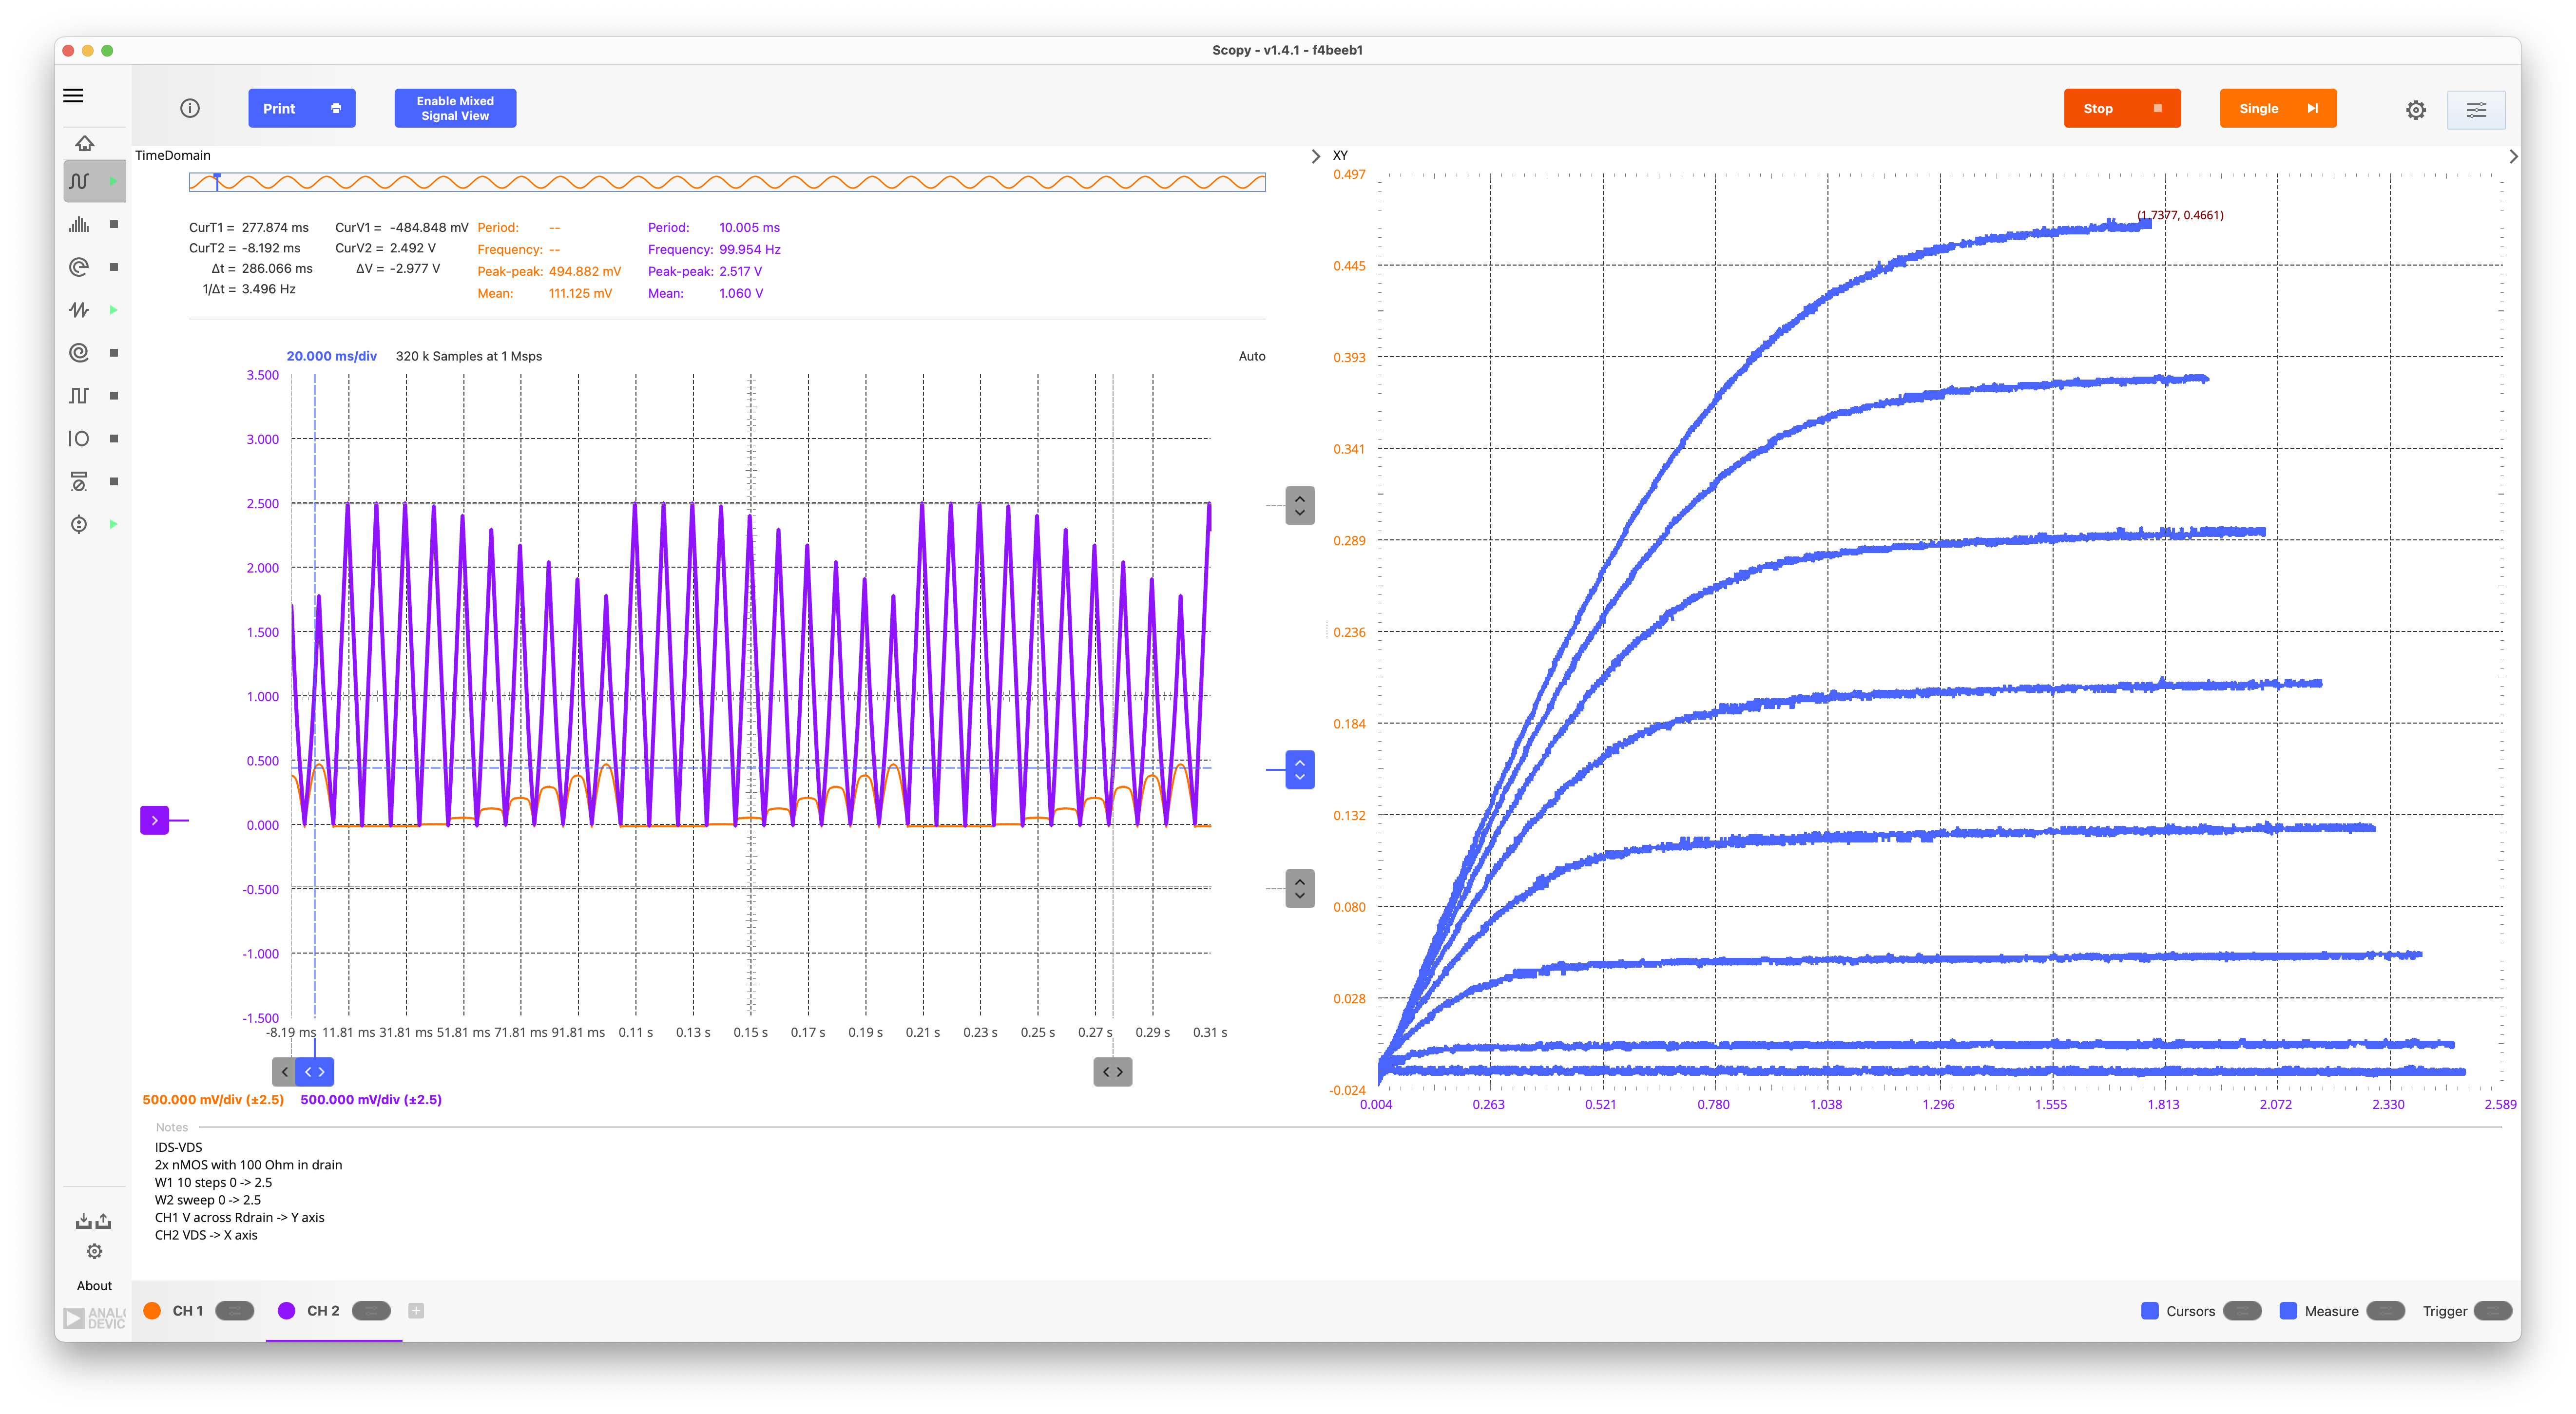
Fig. 2.46 IDS-VDS measurement of a 4x nMOS transistor with a \(100\Omega\) series resistor in the drain; CH1 is measuring the VDS voltage and CH2 is measuring the voltage across the drain series resistor#
This is a simple but relatively crude way to measure IDS-VDS characteristics. As the IDS increases, the voltage drop across the resistor \(R_1\) increases and thus the effective range for the VDS measurements reduces, so a small value of \(R_1\) is preferred; however, small \(R_1\) results in small current-to-voltage conversion and hence low current-measurement accuracy given the accuracy limit of the scope channels.
IDS - VGS Measurement#
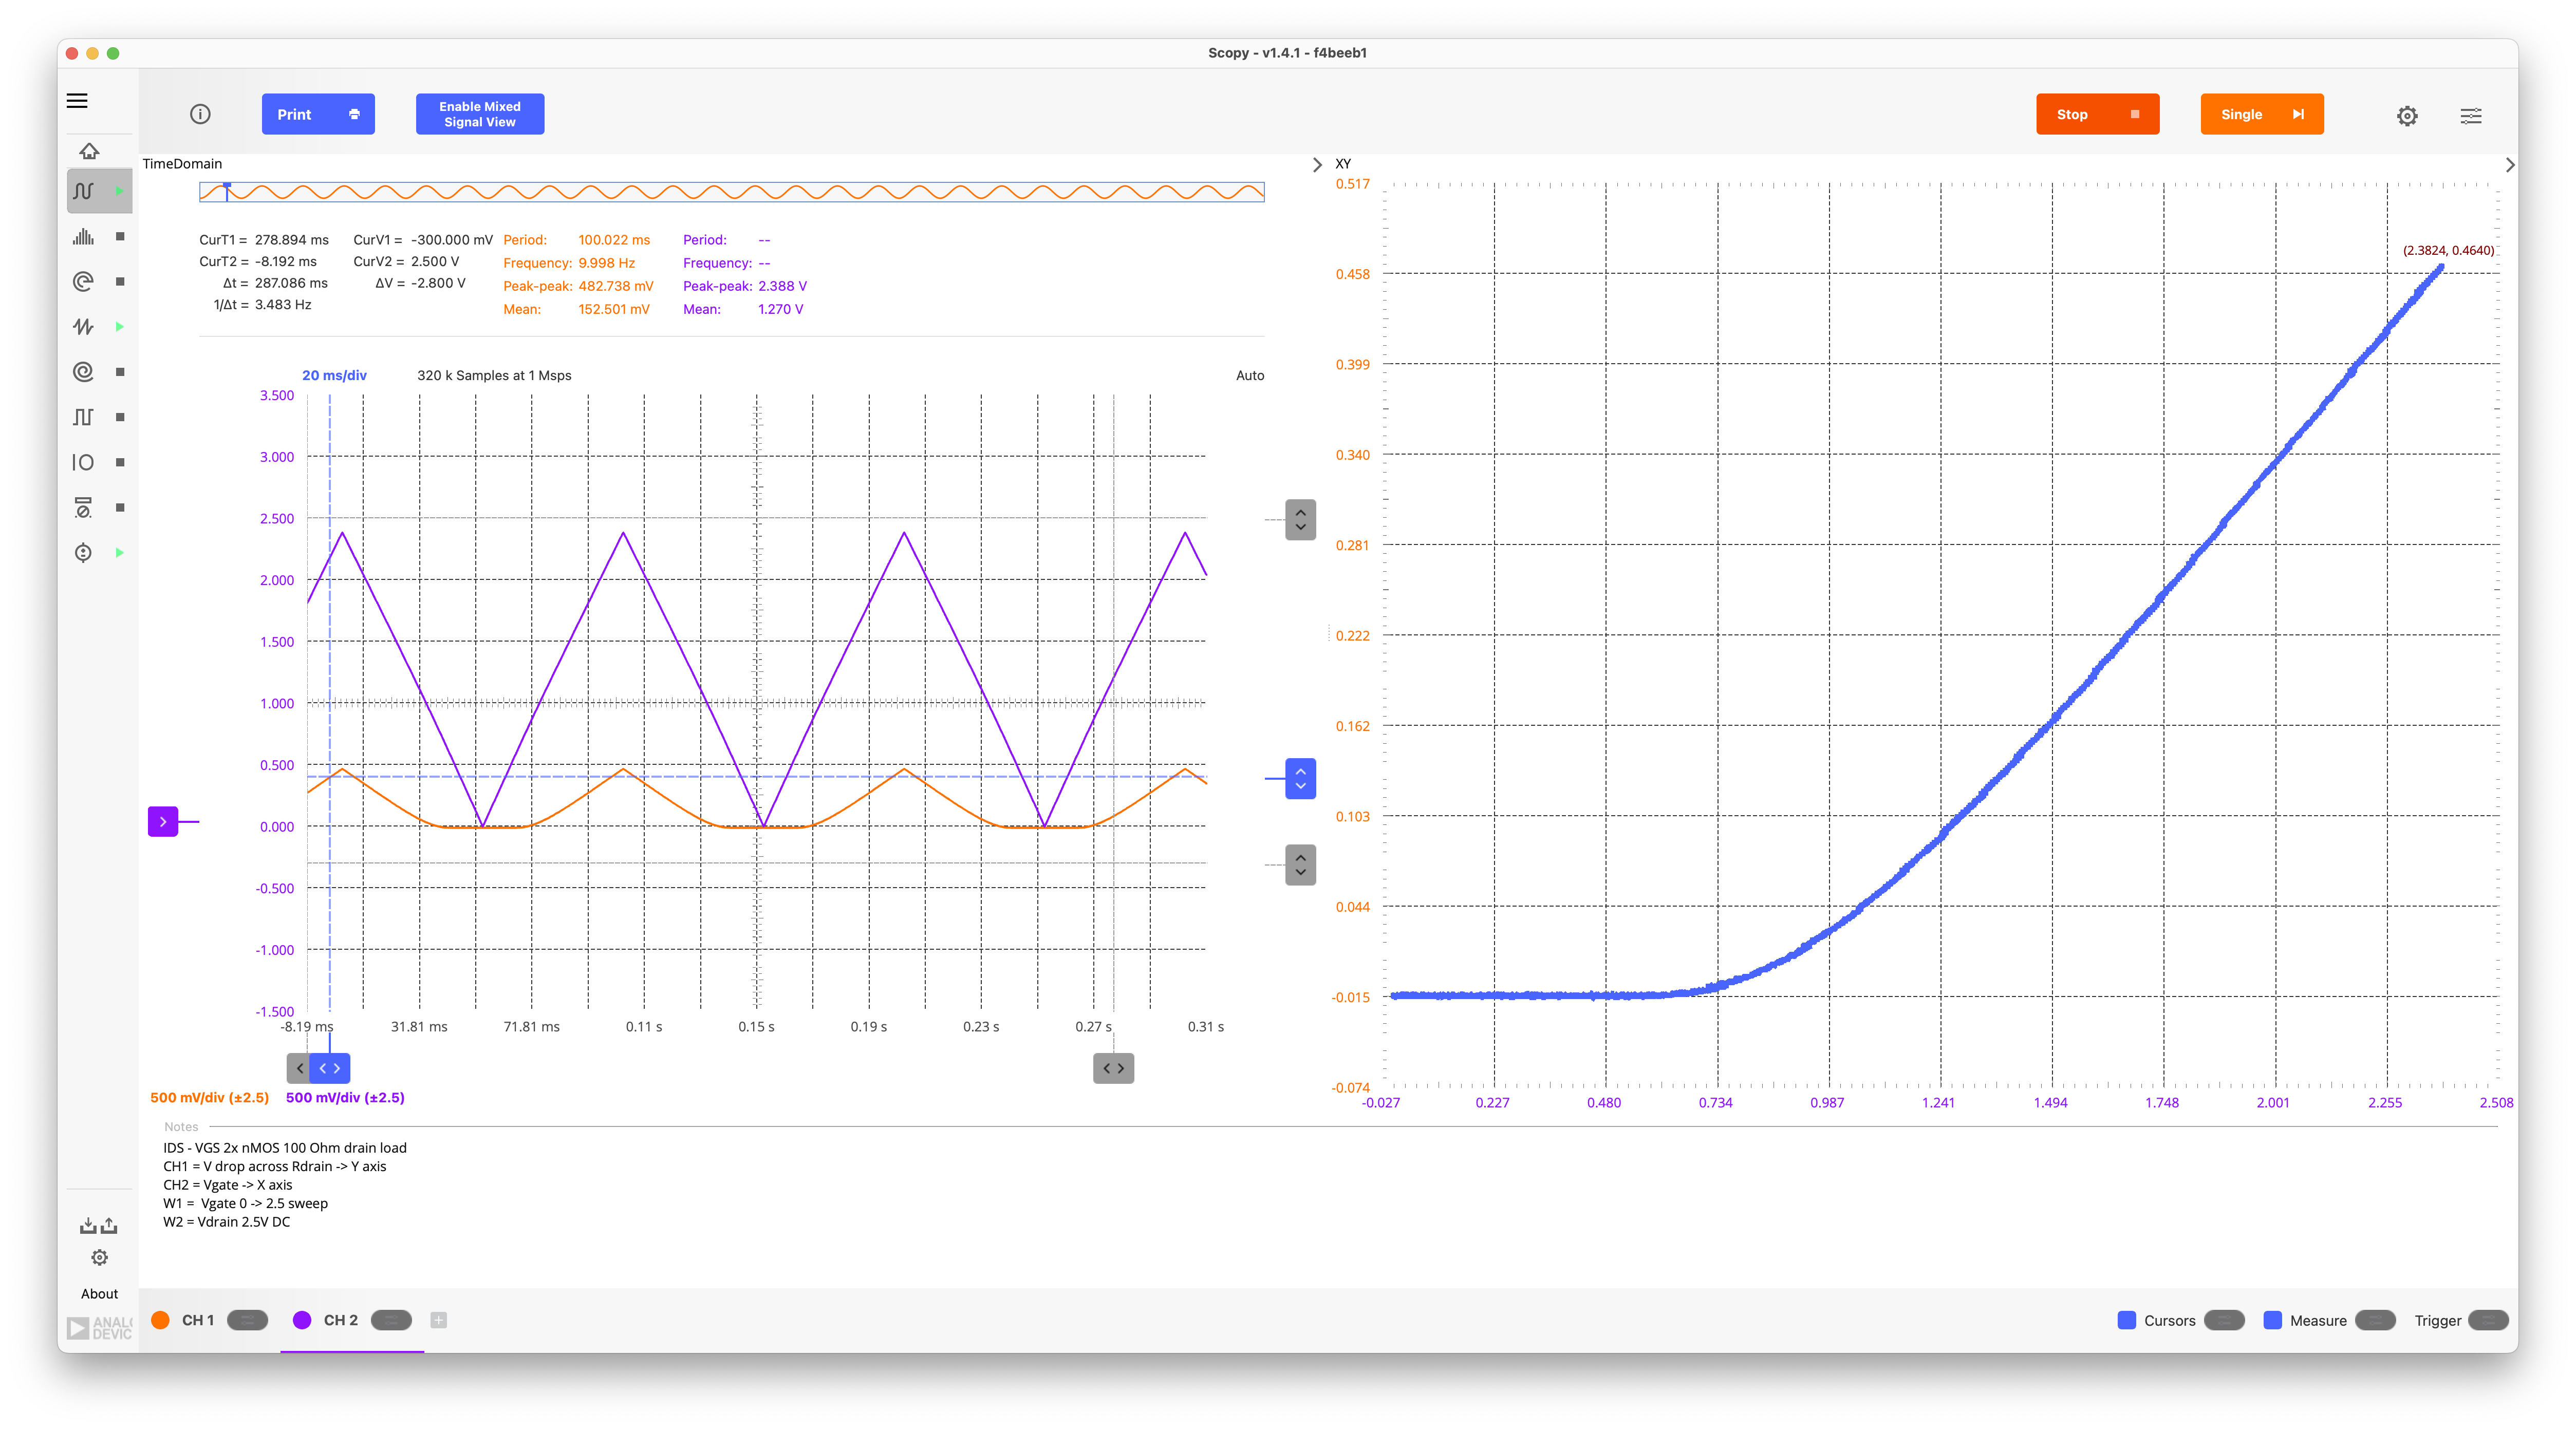
Fig. 2.47 IDS-VGS measurement for a 4x nMOS transistor#
Similarly IDS-VGS measurements can be easily performed by setting VDS to 2.5V and sweeping VGS from 0 to 2.5V with a triangular waveform.
2.4.2. Automated Measurements#
We wrote a python script using the libm2k package to collect the measurement data from the ADALM2000 and made sure that the scope channels operate in their most sensitive \(\pm 2.5V\) range to improve measurement accuracy.
For the pMOS we used a similar setup with a \(100 \Omega\) series resistor but with the appropriate adjustments to the voltage source sweeps.